Lamps Plus Inc. bills itself as the nation’s largest lighting retailer and sells more than 55,000 items on its website–from floor lamps to ceiling lights and chandeliers to outdoor fixtures. Because of the variety of items it offers, the home goods merchant is acutely aware that shoppers come to its ecommerce site for very different reasons.
A consumer who lives in Brooklyn may want two table lamps for his apartment and will probably spend $100 to $200 once he adds the compatible bulbs to his purchase. But a couple who just built a new home in Dallas may need a couple of chandeliers for the dining room and foyer, a ceiling light above the kitchen table, some bathroom sconces and coach lights to flank the garage. And that order value would spike significantly.
To better cater to the varied interests of its shoppers, Lamps Plus, No. 115 in the 2020 Digital Commerce 360 Top 1000, started working with Dynamic Yield in December 2018 and still uses the personalization vendor. The two companies focused their energies on returning visitors to LampsPlus.com.
There’s a long research phase for shoppers buying larger fixtures like chandeliers as they comparison shop at other retailers, evaluate prices and talk over design choices with significant others, says Harry Roth, customer success manager at Dynamic Yield. By the time a consumer comes back to LampsPlus.com for a third or fourth visit without purchasing, the retailer has collected a lot of information about her on-site behavior and can more accurately predict what products are best to promote.
“Similar to the role of sales associates in stores, having the right personalization provides our customers with shorter and more enjoyable shopping experiences,” says Angela Hsu, senior vice president of marketing and ecommerce at Lamps Plus. “And happier customers always translate into improved conversion rates.”
After running hundreds of A/B tests, the home goods retailer went all-in on personalization and improved several key performance metrics. Implementing the following four strategies led to a 40% increase in homepage engagement as measured by clicks, a double-digit surge in conversion rate as well as pages viewed per session and a double-digit drop in bounce rate, according to Hsu and Roth.
Here’s how LampsPlus.com has put its shopper data to work:
- Homepage banner updates: Rather than spotlighting one standard graphic, this space on the site is now personalized based on “user affinity,” which is determined by the product category the shopper has previously browsed. A home furnishings sales banner features an image of a ceiling light for a visitor who has previously navigated to, searched for or clicked on ceiling lights. But the same “up to 50% off” ad with a “shop sale” button instead shows table lamps for a different shopper who has shown interest in that lighting niche.
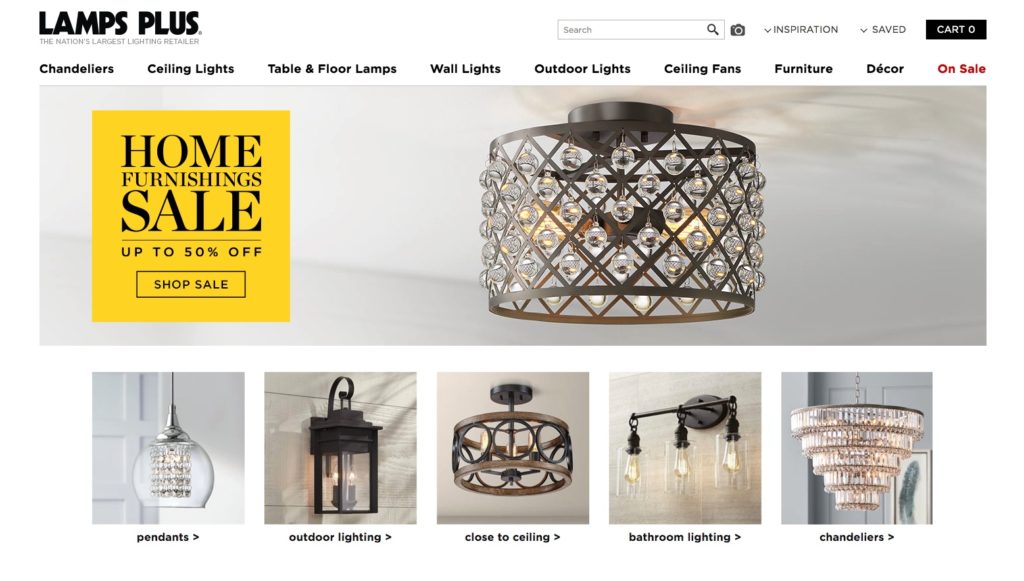
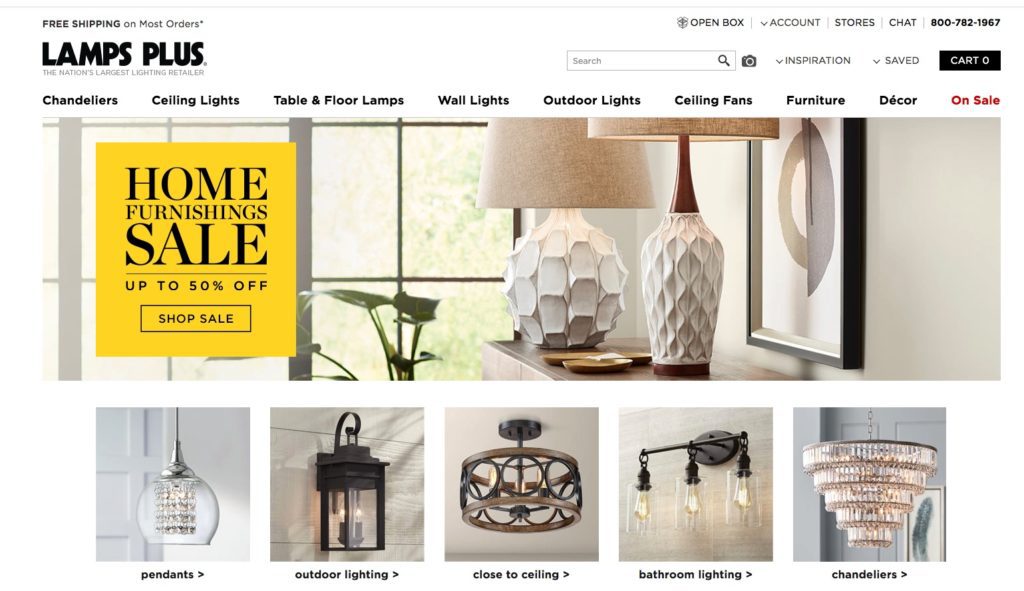
Rather than spotlighting one static graphic, Lamps Plus changes the homepage banner space on its site depending on the visitor’s browsing history.
- Weather-based targeting: Customers coming to the site from areas with temperatures hotter than 90 degrees see a banner related to hot weather, such as a ceiling fan promotion.
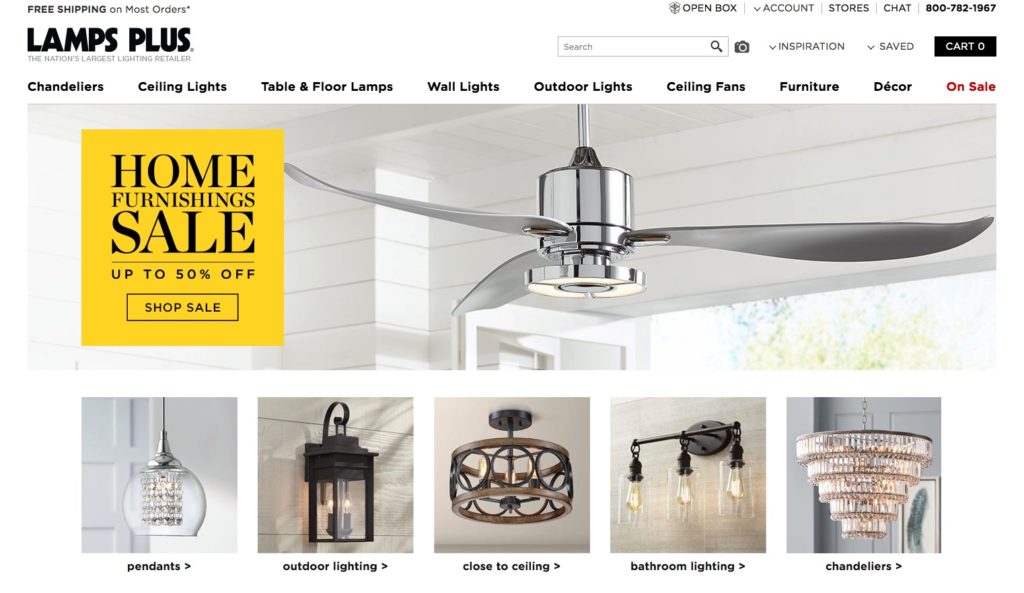
Customers coming to the Lamps Plus site from areas with hotter climates might see ceiling fans.
- Browse-abandonment reminders: When a shopper who has previously browsed one to three products on the site return to LampsPlus.com, she sees a “recently viewed” section. This panel includes thumbnails of items she previously clicked on plus a “just for you” area with several relevant product recommendations right under the homepage banner. If a visitor added an item to the cart in a prior session, an “in your cart” reminder with a thumbnail, the subtotal and a “view cart” button also appear below the homepage banner. This all jogs a returning shopper’s memory and makes it easy to pick back up where she left off, according to Hsu.
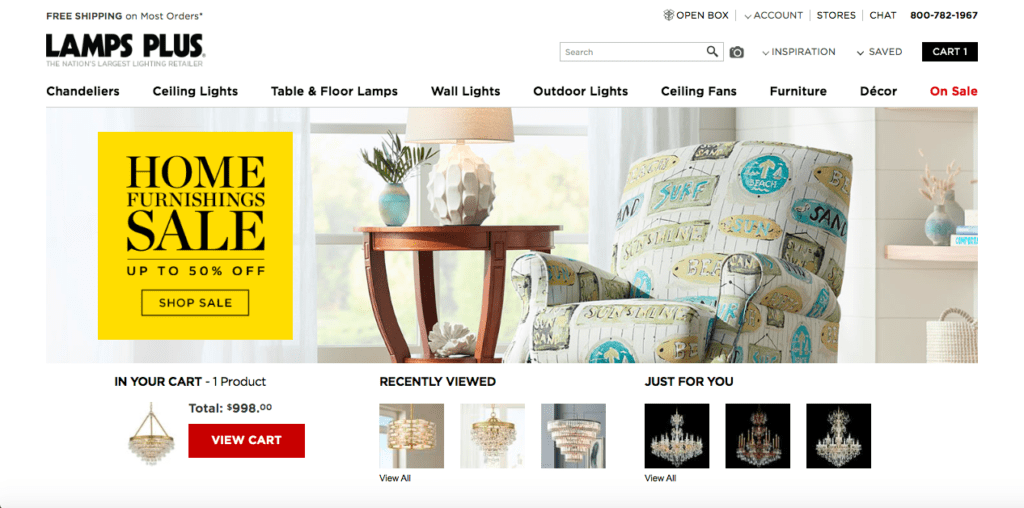
Thumbnails in the “recently viewed” section remind returning shoppers about lighting fixtures they’ve previously considered, and a “just for you” area features several relevant product recommendations.
- Store locator: As a regional retail chain with 36 stores on the West Coast and in the Southwest, Lamps Plus needed to call out its bricks-and-mortar locations for customers in close proximity to its stores without alienating other shoppers without a nearby store. With the help of geolocation detection, site visitors within a few miles of a Lamps Plus store are shown a store location widget at the top of the homepage. The widget also appears for anyone who has searched the term “Lamps Plus stores near me.” Customers who live within 50 miles of a store are shown a store location widget at the bottom of the homepage, and anyone visiting the site outside of a 50-mile radius doesn’t see a store notification at all. Free return shipping isn’t available for all products, so knowing that most orders can be returned to a local store if an item doesn’t work out reduces hesitation for shoppers who don’t want shipping costs deducted from a refund. Additionally, highlighting a local store allows Lamps Plus to promote its free in-store and in-home professional design consultations–an added value for shoppers who want guidance on home projects–and can help convert a potential order.
This article is an excerpt from a section of Digital Commerce 360’s 2020 How To Boost Conversion Rates Report, which provides tips for improving conversion rates and case studies in 11 different areas of focus: mobile, checkout and payments, live chat and customer service, marketing, marketplace selling, merchandising and promotions, site search, user-generated content, website design, website performance and website personalization. The report includes 20+ charts and graphs, consumer insights, and conversion rate data for U.S. Top 1000 and Next 1000 retailers broken down by merchant type and category.