
Key Ecommerce Statistics on Automotive Parts & Accessories Category – Snapshot
AUTOMOTIVE PARTS/ACCESSORIES
Automotive Parts and Car Accessories Ecommerce Statistics
 |
Auto parts online sales rise in 2023
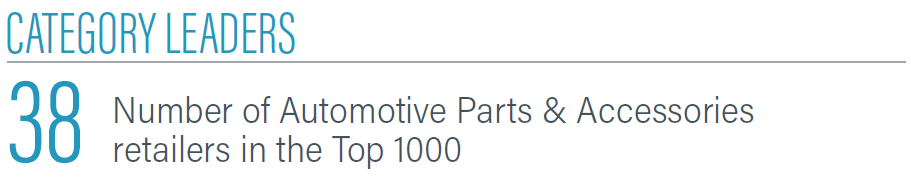
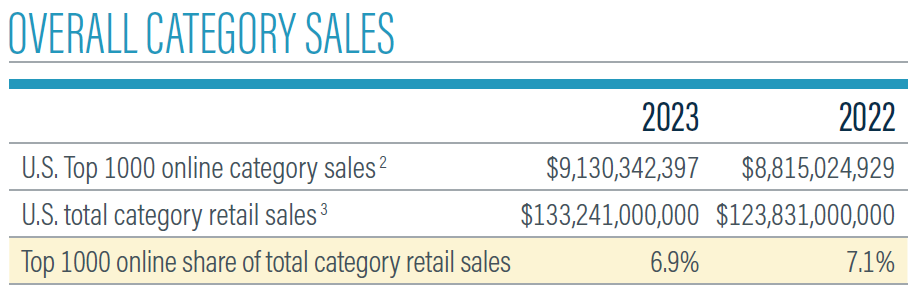
Automotive Parts & Accessories retailers in the Top 1000 had a good year when it came to online sales. The 38 online retailers in the category increased sales to $9.13 billion in 2023. That’s up 3.5% from $8.82 billion in 2022.
That’s a significant percentage of total retail sales (online and offline) in the category. The U.S. Commerce Department estimated the Automotive Parts & Accessories category brought in $133.24 billion in 2023. That’s up 7% from $123.83 billion a year earlier.
Online auto sales fighting headwinds
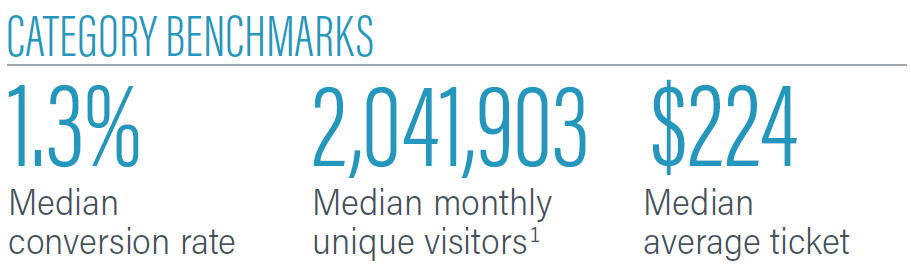
Nevertheless, much of that rise can be attributed to inflation, which stood at 3.4% year over year in December 2023. Conversion rate in 2023 was 1.3% for the category. The median when looking at average ticket price was $224. That’s up $13 from $211 in 2022. Moreover, the category saw significant growth in monthly unique visitors to ecommerce sites. The median increased to 2,041,903 in 2023 from about 881,166 in 2022.
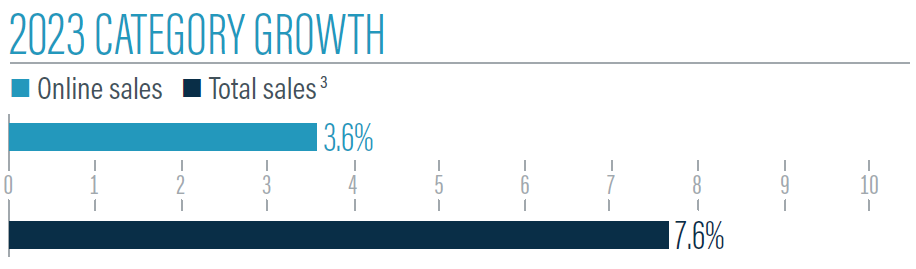
Category growth for Automotive Parts & Accessories retailers in the Top 1000 was quite different for online sales and total sales (online and offline). Category sales declined 3.6% online in 2023, while total sales also fell to 7.6%.

Demographics of online Automotive Parts/Accessories shoppers
Digital Commerce 360 research shows online Automotive Parts & Accessories shoppers of different age groups purchase products online at similar rates.
Those ages 45-54 shopped online for their car parts 18.8%. Those 25-34 and 35-44 made their online purchases at similar rates (23.2% and 23.0%, respectively). Those 18-24 didn’t buy online quite as much from Top 1000 retailers in the category as the above-mentioned age groups, but they still accounted for 14.3% of sales.
The age groups who accounted for the fewest sales were the oldest. Those 65 or older accounted for 7.3% of online Automotive Parts & Accessories sales. Those 55 to 64 accounted for 13.5%.
 |
 |
Source: Digital Commerce 360 1. Digital Commerce 360 analysis of SimilarWeb traffic data. 2. Includes only U.S. sales from the sites of U.S.-owned retailers for consistency with the U.S. Department of Commerce’s methodology. 3. Digital Commerce 360 analysis of U.S. Department of Commerce retail data. 4. Medians won’t sum to 100%
Automotive Parts & Accessories Category News Feed